


BibTeX | RIS | EndNote | Medlars | ProCite | Reference Manager | RefWorks
Send citation to:
URL: http://nmj.goums.ac.ir/article-1-1214-en.html


 , Babak Rastegarimehr1 , Mohammad Sajedinejad1 , Atefeh Zahedi2 , Najiballah Baeradeh3 , Leila Rezaei4 , Ali Ebrazeh5
2- Asadabad School of Medical Sciences, Asadabad, Iran ,
3- Torbat Jam Faculty of Medical Sciences, Torbat Jam, Iran.
4- Kermanshah University of Medical Sciences. Kermanshah, Iran
5- Faculty of health Qom University of Medical Sciences, Qom, Iran
Introduction
Development and health are closely related. Development failure can have adverse effects on people's health. The presence of inequality and its dimensions in the community are important signs of underdevelopment (1).
Since one of the essentials for achieving sustainable human development is desired access to health services and facilities, the necessity of a relationship between sustainable human development and improving the health care system is significant (2).
One of the main components of sustainable development is health which is an integral part of improving the quality of life. Several appropriate indices, models and methods are needed to study the extent of development in the community (3).
Lack of health facilities and human resources and their inadequate distribution in urban and rural areas are major problems of providing health services in third world countries. Although uniform and proportional distribution of health resources and related services are necessary, the unequal distribution of wealth and inequality in social rights has made most people in the community lack access to health care facilities appropriate to their needs (2).
The main and important reasons for inequality in the distribution of health sector resources include inappropriate and poor budget allocation to the health sector, and inadequate and long-term planning. Since awareness of access to health services is the first step in fair distribution of these services according to people's health needs and population level (4), we decided to conduct this study.
The health sector is considered as one of the most important social sectors of the country which plays a decisive role in community healthcare. Health is also related to socio-economic and cultural progress (4). Providing desired health services in addition to the number and abundance of human resources depend on other cases such as work motivation and how they are distributed in different areas. Other resources such as money, credit, beds, equipment, and buildings are also complementary to human resources, so their proper and adequate number and distribution will contribute to the provision of health services to individuals (5). In a study conducted by Taqvaei et al., it was found that in addition to the differences among provinces in terms of access to health services, also a difference was found between their cities (6).
Numerical taxonomy method is used in the present study. This method was first proposed by Anderson and became a tool for classifying different geographical areas in 1986 because it could divide the indices into homogeneous subsets and then rank (7). Since identifying and classifying provincial cities in terms of health indices are important for more accurate planning and implementation of health plans, and addressing problems, this is an important step towards a more appropriate and fair distribution of health facilities and services, which is an important component of sustainable and comprehensive development, led the researchers to conduct a study on the status of development of cities in Khuzestan Province in terms of health indices using numerical taxonomy model.
Methods
This descriptive study was conducted in Abadan, Khorramshahr and Shadegan with the aim of determining the status of development and access to health and treatment resources. The data collection tool was a checklist containing information needed to calculate 15 health indices in 2016; This information, which included the number of general practitioners, specialist physicians, dentists and paraclinical centers providing medical services and the total population of each of the cities of Abadan, Khorramshahr and Shadegan, was collected from the Deputy of Health and Medical Sciences of Abadan University of Medical Sciences and was investigated using numerical taxonomy and using excel software. Numerical taxonomy is a good method to rank areas in terms of development. This method is able to divide the examined cases into a homogeneous subset and rank the elements of each homogeneous subset (7). The studied health indices include ratio of general practitioner to a population of n=1000 and ratio of specialist, dentist, pharmacist, home health, urban health centers, rural health centers, active beds, laboratory, rehabilitation centers, radiography centers, pharmacy, midwife, hospital and clinic to a population of n=10,000.
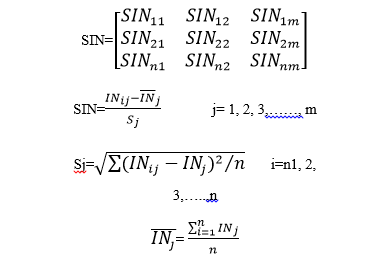
Numerical taxonomy method was implemented at several stages, thus at the first stage the data matrix is formed which included variables (m=15) and areas (n=3).
.png)
The second stage is standardization of the data matrix to eliminate the effect of different units and replace the same scale. Each set of data was subtracted from the mean and divided by standard deviation.
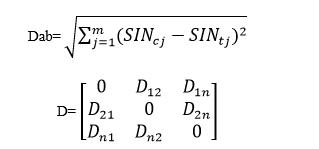
At the third stage, the distance was calculated and the distance matrix was formed so that the distance of each city from the other cities was calculated for each of the indices in pairs, and then the matrix was formed. This matrix, which is a composite distance matrix, is symmetric and its main elements are zero.
At the fourth stage, homogeneous distance was determined and homogeneous options were ranked. At this stage, the upper and lower limits were calculated and homogeneity is established if the minimum distance of each city is in the range of L1- L2.

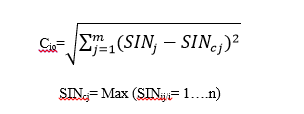
At the next stage, in order to rank each city in terms of development, for each variable, we chose the maximum value between the studied cities and considered it as a model. Then, for each index the composite distance of each city from the model city was determined.
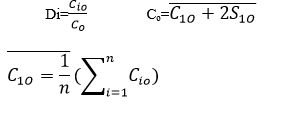
Finally, using combined indices of underdevelopment, the rate of development was determined as the closer the index was to zero the more developed the target city was, and the closer it was to one, the more undeveloped the target city was.

Results
In order to analyze the data at the first stage, the data matrix was formed for 15 indices and 3 cities studied including Abadan, Khorramshahr and Shadegan (Table 1).
At the second stage, using the mean and standard deviation of the indices, a standard data matrix was formed to replace the unit scale and eliminate the effect of different units (Table 2).
|
Table 1. Matrix of Mean Score for Developmental Indices by Cities
|
||||||||||||||||||||||||||||||||||||||||||||||||||||||||||||||||||||||||||||||||
|
Table 2. Standardized matrix of development indices
|
||||||||||||||||||||||||||||||||||||||||||||||||||||||||||||||||||||||||||||||||
At the fourth stage, the maximum and minimum critical range was used to determine the homogeneous distance between cities. The homogeneity is true if the minimum distance of each city from the other city is between the upper and lower critical range. According to the mean and standard deviation of the values for the shortest distance between cities, which were 5.3613 and 1.3588, respectively, the upper and lower limit values of homogeneity were calculated as follows:
d⁺ = 5.3613 + (2×1.3588) = 8.0789: Upper limit of homogeneous distance
d⁻ = 5.3613 – (2×1.3588) = 2.6437: Lower limit of homogeneous distance
Considering the upper and lower limit values of homogeneous distance and the shortest distance between cities, all cities (areas) were homogeneous and grouped into one group.
At the fifth stage, optimum utility and at the Sixth stage, the rank and relative level of develop-ment were determined for each city (Tables 4 and 5).
Finally, the results of utility showed that Abadan was ranked as developed (0.47), Shadegan was ranked as the least developed (0.78) and Khorramshahr was ranked as undeveloped(0.81), respectively (Table 5).
|
Table 3. Matrix of composite distance of Abadan, Khorramshahr, and Shadegan
|
|
Table 4. Calculation of optimum utility for each city
|
|
Table 5. Calculation of degree and determination of rank and relative level of development of each city
Upper limit of optimum utility: C = 6.1832 + (21.3638) = 8.9107
|
Discussion
Today, the economists in favor of balanced growth in different areas of the country believe that dynamic growth theory has not only succeeded in reducing and resolving regional inequality in undeveloped countries, but also exacerbated it. For this reason, the need for sound regional planning in order to achieve balanced development is recommended (8). On the one hand, fair and optimal distribution of health care resources and equal access for all to these services is one of the goals of all governments and health systems in all countries. The indices of development of health care facilities and resources in developing countries do not have a fair and balanced distribution across different geographical areas and this gap exists in Iran (9). The results of the present study also showed that Abadan in terms of access to health indices is developed, Shadegan is less developed and Khorramshar is undeveloped. Different studies have shown similar results such that in a study by Rezai et al., which was conducted in Kermanshah Province, 50% of the province's cities had a very good status and the other 50% had a semi-poor and deprived status (7). Mousavi et al. (2009) in a study using Scalogram Model concluded that there is a large gap in the utilization of structural health indices among the cities of Kermanshah Province. Kermanshah was the most developed and Sar-e Pol Zahab was the most deprived. Also, the results of their study showed that about 50% of Kermanshah Province's cities were not developed and less developed and about 35.72% were developed (10). The study results of Sadeghifar et al. indicate that there is a large gap in the utilization of Structural Indices of Health in our different cities of Bushehr Province. So that a city (Genaveh) is relatively developed, and five cities (Bushehr, Deilam, Jam, Dashtestan and Dashti) are less developed and three cities (Kangan, Tangestan and Dayer) are undeveloped (1). In studies by Nastaran (11) and Zarrabi (12) in Isfahan Province, Bahadori (13) in Golestan Province, Sham Anjam Shoa (14) in Kerman Province, Hamozadeh (15) in West Azarbaijan Province and Amini (16) in all provinces of Iran, similar results were obtained in terms of the gap in utilization of health indices.
According to previous studies, lack of proper infrastructure, being far from provincial capital, difficult access, inadequate roads, high population, low level of culture, people's unwillingness to progress, lack of cooperation with public sectors, unemployment rates, illiteracy, social problems, self-treatment belief, and lack of interest in referring to a physician are some of the factors that cause development or underdevelopment of cities (17).
ConclusionAccording to the study results, in order to improve the status of cities in the health sector for bet-ter management, it is recommended to formulate a comprehensive development-oriented plan to reduce gaps and inequality in terms of health indices, develop main and infrastructure indices and pay special attention to the population of each city and area, and cities should be strength-ened in terms of these indices. Khorramshahr and Shadegan are not developed and less devel-oped in terms of access to health indices that should be prioritized for the development and en-hancement of specialist workforce.
Acknowledgements
This research project has been financially supported by Abadan School of Medical Sciences under contract number of 94SST-0014 and IR.ABADANUMS.REC.1394.025 Ethics Code.
| Rights and permissions | |
 |
This work is licensed under a Creative Commons Attribution-NonCommercial 4.0 International License. |
